0
abdulmoiz.khan created
Hi
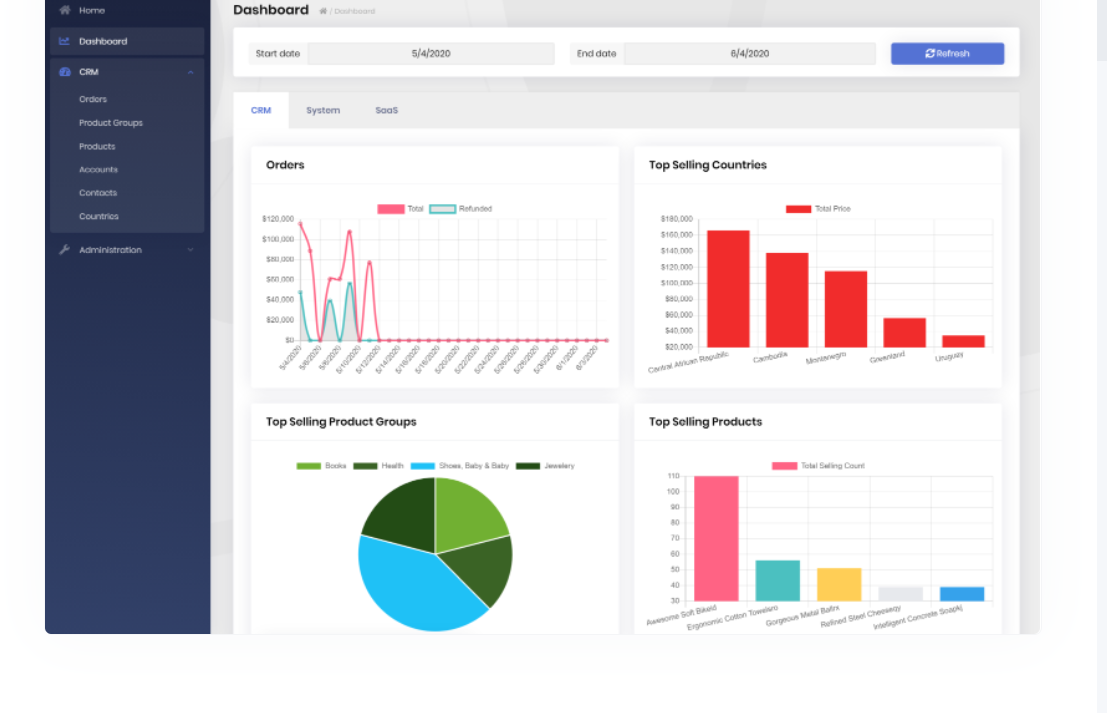
I want to include Graphs (Pie, Line, Area) in my TenantDashboard page, something like shown on your documentation. But when I download the source code of demo. tenant-dashboard.component is empty and have no code present in it. Also documentation lacks modules to create Charts. Can you please guide me how to use charts like shown below in your demo page. Thank you!
If you're creating a bug/problem report, please include followings:
- ABP Framework version: v4.4.4
- UI type: Angular
- DB provider: EF Core
- Tiered (MVC) or Identity Server Separated (Angular): yes
- Exception message and stack trace:
- Steps to reproduce the issue:"
1 Answer(s)
-
0
Hi
The chart is not a feature of ABP, we use the popular library.
You can use any library you know, for example: https://mdbootstrap.com/docs/angular/advanced/charts/