https://docs.abp.io/en/abp/latest/Localization#extending-existing-resource
You can override existing localized text in different solutions
Thank you - I will try to make use of the including basic type into any empty resource class of ModulePermission class. Hope it will work out.
Could you please let me know if it is possible to pass-through additional information of route (like this module ID) from Angular app somehow to a back-end?
when I am loading the specific page via URL:
or just navigating to the app https://localhost:4200 (and expecting to see only specific module ID-related pages in the menu)
inside your method:
public override async Task<MultiplePermissionGrantResult> CheckAsync(PermissionValuesCheckContext context)
? I need information about all module IDs (module ID matches Module Role, which contains permissions) for my Angular app pages to check out which of them are to be displayed / hidden.
My teammate mentioned that "dynamic permissions" do not fit us for some reasons. I don't know the details yet, I will get back to this later.
Meanwhile I have the following questions.
I moved Module Role functionality into a separate solution which needs to be consumed in two different solutions, layer-by-layer: Domain.Shared, Domain, Application.Contracts, Application, EntityFramework Nuget packages, the same way as ABP solution looks like.
a) ApplicationService layer traditionally contains some localized information:
public class ModulePermissionAppService : ApplicationService, IModulePermissionAppService
And I need to customize resource localization in the places like this:
throw new BusinessException(DomainErrorCodes.NotFound, _stringLocalizer.GetString("Roles:RoleNotFound"));
i.e. dependency-injected _stringLocalizer which is IStringLocalizer<SomeResource> needs to have different value in each case. For instance, IStringLocalizer<ResourceA> in one solution and IStringLocalizer<ResourceB> in another solution. How do I do that?
b) I'd like to pass Authorization Permission class constants in some nice uniform way:
    [Authorize(THIS_NEEDS_TO_BE_CUSTOMIZED.Roles.Modify)] //
    public async Task DeleteRoleAsync(bool isModuleRole, Guid id, bool ignoreDeleted = false)

    [Authorize(THIS_NEEDS_TO_BE_CUSTOMIZED.Roles.Read)] //
    public async Task<RoleDto> GetRoleAsync(Guid id)
I guess the
IsDeletedfield value of one of them is true Could be, I've deleted the duplicate and cannot check it out...
The implementation is almost complete. I have the following question.
Let's say my new Role Management page is located in Solution A which has this page in UI. However, I want to assign and revoke granted permissions for other Solutions, each of them has own PermissionDefinition.
How to do that? Indeed, Solution A does not have references to another solutions, particularly. it does not have references to Solution B Application Contracts project, where definitions are described. So the "Role Management" page in Solution A does not list the permissions from Solution B and thus cannot assign or revoke them.
Thank you. Overriding AppService is ok too.
Could you please tell me if it can be considered a bug?
Why ABP allowed me to create two roles with the same name for null-tenant? ABPROLES does not have constraint for [TENANTID, NAME], but I can't figure it out how to make use of two roles with the same name for the same tenant...
You can replace the component with yours and use the your own service to get roles. https://docs.abp.io/en/abp/latest/UI/Angular/Component-Replacement
I already use a DepartmentComponent instead of ABP OrganizationUnitsComponent.
It generally "mimics" the ABP "Organization Units" component behavior.
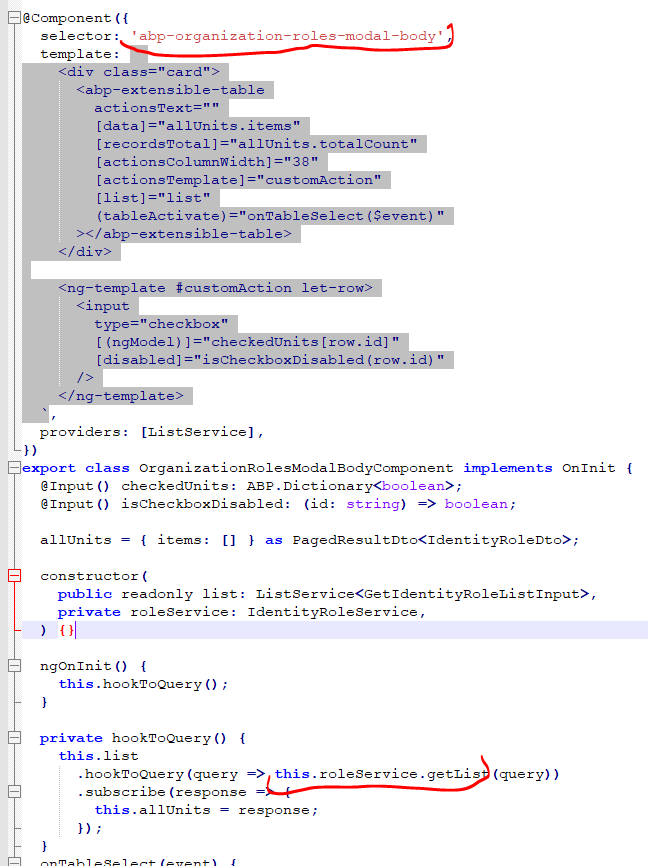
The problem is that when on "Roles" tab you click "Add Role" - modal component OrganizationRolesModalBodyComponent is shown which itself is NOT replaceable. It uses the following service to fill the list of roles:

The only way to affect this list that I can see it to replace dependency-injected service IdentityRoleService. However, as I have written before, I don't know how to do it properly (if possible).
You can override the repository to filter the roles.
This approach does not suit me well. I already use ABP EfCoreIdentityRoleRepository in many places of my solutions. I'd prefer to leave ABP EfCoreIdentityRoleRepository intact, but instead replace client-side ABP IdentityRoleService for specific component(s):
I've tried to inherit this service, but bumped into the problem: for some reason ABP implementation uses arrow functions instead of prototype-level functions, so I cannot override them in my class:
There are no "MR" permissions there. I have the idea why. Meanwhile I'm going to create a separate package for optional adding Module Roles functionality to different projects. So the questions are:
a) Is it possible to have all providers on ONE layer? Because currently they are split between "Domain" and "Application.Contracts" layers following ABP source code structure. Maybe I'm missing something:
My idea is to enable this functionality in minimum of steps, i.e. just include the package to one layer (project) or to configure it in one place of one project (if possible);
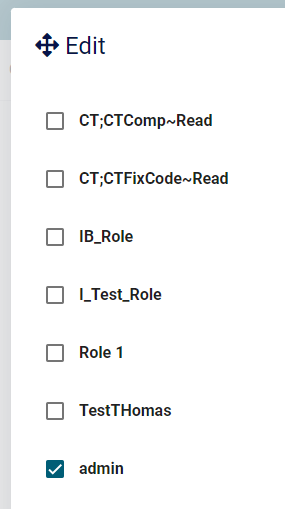
b) How to filter out this query? I don't want to show "MR" roles here:
Sorry, cannot prepare the test project which would cover our functionality, it would take too much time.
I've managed to resolve the permission issue, I guess. Probably it was caused by the scenario when a user has no user roles assigned - only his department's roles... I will get back to this part later probably.
I guess it's ok, the Front-end loads permission grant datas from backend
It does not look right now... Please have a look at whole chain:
a) current user has "Role 1" assigned":
b) "Role 1" is granted "CT;CTApli:DT~Modify" permission:
c) Angular app does not see this permission (even though back-end check in the AbxRolePermissionValueProvideris ok - probably there is no direct connection between its result and what getGrantedPolicy returns at client-side) :
I'm completely lost. I've overridden PermissionAppService, but it does not resolve the issue - I'm getting this kind of exception even on "R" provider - now I'm trying to READ permissions of an ordinary role:
Authorize attribute decorating this method, no permission at all!The exception happens on GetAsync:
    public async Task<PagedResultDto<PermissionGrantInfoDto>> GetPermissionsAsync(GetRolePermissionsInput input)
    {
        var role = await _identityRoleRepository.FindAsync(input.Id, false);
        if (role == null)
        {
            throw new BusinessException(DomainErrorCodes.NotFound, _stringLocalizer.GetString("Roles:RoleNotFound"));
        }

        var permissionListResultDto = await _permissionAppService.GetAsync(RolePermissionValueProvider.ProviderName, role.Name); !!!EXCEPTION

        var itemsDto = permissionListResultDto.Groups.SelectMany(x => x.Permissions)
            .WhereIf(input.IsGranted.HasValue, x => x.IsGranted == input.IsGranted.Value)
            .WhereIf(!string.IsNullOrWhiteSpace(input.Permission), x => x.Name.IndexOf(input.Permission, StringComparison.OrdinalIgnoreCase) != -1 || x.DisplayName.IndexOf(input.Permission, StringComparison.OrdinalIgnoreCase) != -1);

        return new PagedResultDto<PermissionGrantInfoDto>
        {
            TotalCount = itemsDto.Count(),
            Items = itemsDto.ComplexOrderBy(input.Sorting).Skip(input.SkipCount).Take(input.MaxResultCount).ToList()
        };
    }
Volo.Abp.Authorization.AbpAuthorizationException: Exception of type 'Volo.Abp.Authorization.AbpAuthorizationException' was thrown. at Microsoft.AspNetCore.Authorization.AbpAuthorizationServiceExtensions.CheckAsync(IAuthorizationService authorizationService, String policyName) at Volo.Abp.PermissionManagement.PermissionAppService.CheckProviderPolicy(String providerName) at AbxEps.CentralTools.Permissions.CentralToolsPermissionAppService.CheckProviderPolicy(String providerName) in C:\CT\AbxEps.CentralTools\aspnet-core\src\AbxEps.CentralTools.Application\Permissions\CentralToolsPermissionAppService.cs:line 49 at Volo.Abp.PermissionManagement.PermissionAppService.GetAsync(String providerName, String providerKey)
Probably it is somehow related to my new custom "Roles" page. When I navigate to it, unlike to other pages, AbxModuleRolePermissionValueProvider => CheckAsync is not triggered. I relogged in, but it did not help.
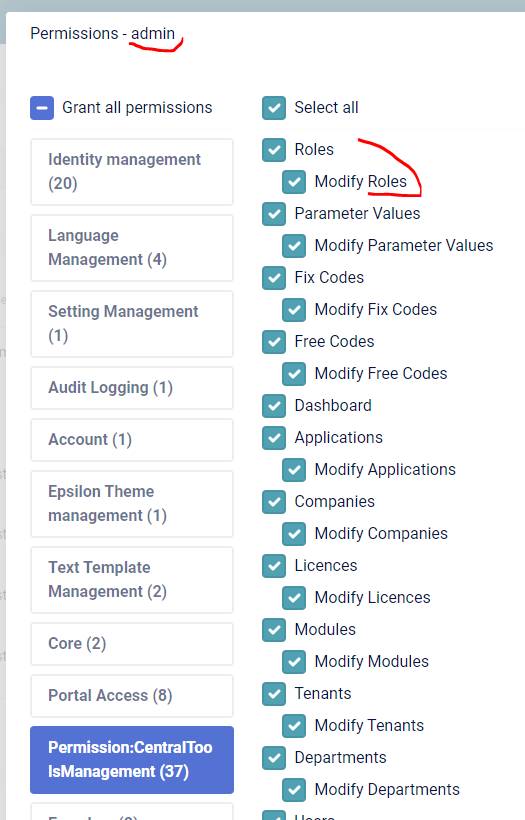
The PermissionProvider seems to be OK, it does contain the required permissions:
 And the user does contain these permissions:


BTW, "admin" is a public role from user's department, not a manually assigned. But it should not be difference, right?
Does the currently logged-in user have the permission?
Well.. I understand now. No, he does not. But since "MR" are not only permissions for ordinary roles, but also they are ABP roles themselves (just having a special extra properties) - I want them to be always available, like any role (not like permission which must be granted). They are never supposed to be checked as permissions (their permissions are). So how to make them always available?

